Living in Cape Town exposes you to many great things, like great food and beautiful vistas, but also to occasional fynbos fires on Table Mountain. If you live in the foothills of a mountain, as I do, sound of a helicopter flying above might give you chills. There are two things that jump to my mind when I hear a helicopter flying above my neighbourhood:
- mountain rescue, or
- a water-bombing helicopter.
Last Saturday I was lounging in the Sun with a biography of R. A. Fisher when a helicopter appeared, the second kind. It was flying up and down fetching water all day. Unable to read, due to the noise pollution, I recalled all the appearances of a water-bombing helicopter since I lived in my basement flat. From those few data points I concluded that most of the fires on Table Mountain happen on weekends! I had to investigate…

Side note
Bush fires are an essential part of South Africa ecosystem and as such will always be a part of every Capetonian life. According to official reports, in the Western Cape bush fires occur during the summer months and most are started by accident by people. Fun fact, in mountainous regions fires are also started by falling rocks.
Data
Now, I need to get me some wild fire dataset to see if my original inference is even remotely accurate. Luckily, the City of Cape Town portal stores this data in OpenOffice spreadsheet format. If you are interested in this data and how I processed it, here is a link to my github. You can also find it on Kaggle!
There are 88480 records for the vegetation fires spanning period from January 2009 to September 2017, almost. The data is clearly split into two formats, OpenOffice spreadsheet before 2016 and a database dump after. There is about 5 months of records missing in the time Cape Town decided to change formats. The number of columns and their names have also changed. A real headache… Definitely, the database dump is of lower quality than the OpenOffice spreadsheet with a lot of missing data. Lets hope they will do better with the next data update.
Vegetation fires
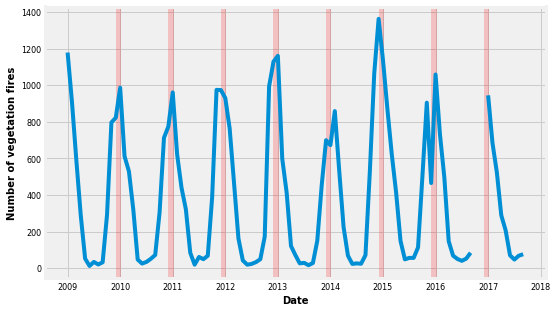
We can group our 88k records into months in each year. If we sum the number of fires recorded each month and plot it, we see straight away that there is seasonality, a regularly repeating pattern of highs and lows, of vegetation fires. For your convenience I marked the month of December with a red line as in South Africa summer runs from November to March. There is no clear trend to this data, meaning the number of fires on average is not increasing or decreasing. This is interesting as South Africa has been experiencing drought for years now and one would expect an upward trend.
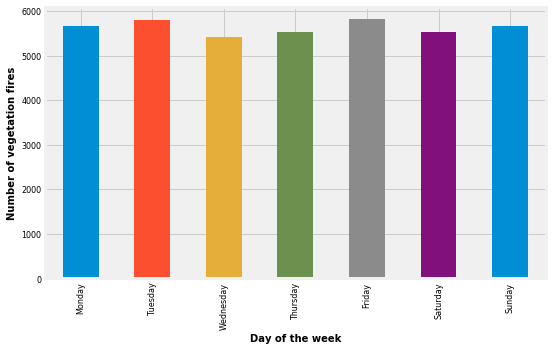
What really interests me is if Table Mountain burns more on weekends. Now, if we take the same data and plot number of fires per day of the week we see that there is no difference on average between number of fires on a Tuesday and Sunday! Well, let us don’t give up just yet. My original question was about fires on the Table Mountain and not all recorded vegetation fires.
Fire on the mountain!
Table Mountain National Park incorporates Table Mountain, Cape Point and the area between (map). I only included unambiguous areas of the park such as:
- Signal Hill,
- Oudekraal,
- Table Mountain,
- Cape Point,
- Silvermine,
- Signal Hill,
- Lions Head,
- Wynberg Nu.
I excluded places like Noordhoek, which is also a suburb, as I don’t have geographical location of fires and where the park starts and where it ends exactly.
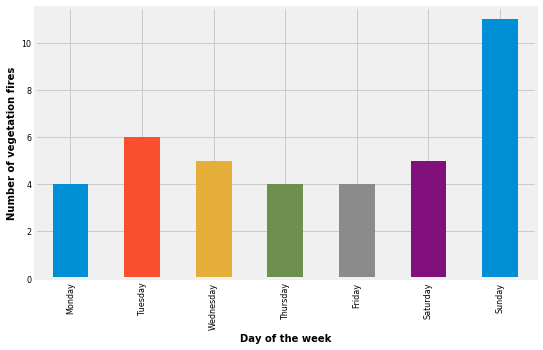
This surviving set of data gives us only 39 records, out of almost 90k! Lets repeat the exercise from previous paragraph and plot number of fires per day of the week. There it is, most of the fires occur on a Sunday.
The bottom line is it might all be a fluke and not a real effect. To determine that we have to perform hypothesis testing. Our NULL hypothesis is that there is no effect and fire on the mountain is as likely to happen on a Tuesday as it is on a Sunday. I’ve committed few data fallacies here as well, like cherry picking, sampling and survivorship bias and McNamara fallacy. Please shout at me if you find more. This problem is complex and some domain knowledge would be very beneficial. Still I would have to quit my full time job to work on this problem.
Bonus: who is at fault?
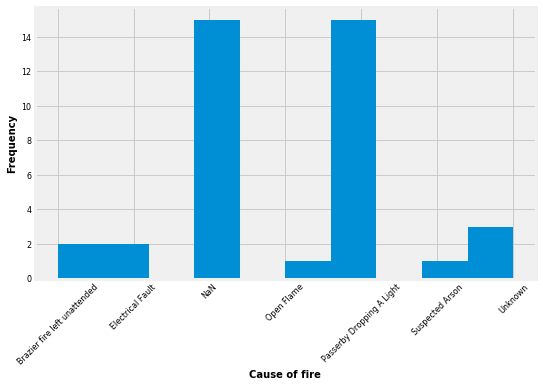
As mentioned in the introduction, most vegetation fires are started by accident by people. Luckily, details about the cause of fire are given in the data. For our 39 records we have the following causes:
- Passerby dropping a light,
- Brazier fire left unattended,
- Unknown,
- Electrical fault,
- Suspected arson,
- Open flame,
- NaN (empty field).
Histogram below shows the frequency for each fire cause. The most frequent one is a passerby dropping a light. Unfortunately, our data contains many NaN values (different from ‘Unknown’ cause). There is so many of them that they could easily change the look of our histogram. As a side note, those NaN values come from the database dump I talked about in Data section.