Welcome to the first post of 2018! It’s about asbestos…
First, what is asbestos? Well it is a mineral that can be pulled into fine fibres with high resistance to heat, electricity and chemical corrosion. In the past it was a common ingredient in construction materials (caveat: this is at least true for the European Union). Why in the past? Asbestos is a threat to health due to its very fibre structure. Those microscopic fibers can become trapped in the respiratory system, causing cancer and other disease decades after exposure.
Second, where is Poland?! The answer depends on how grumpy the internet is on that day. My home country, Poland, is located in the Eastern or Central Europe. Poland joined the European Union in 2004 and suddenly stuff was required of her. Strangely enough, Poland is the only European country that plans to be free of asbestos by 2032. The National Asbestos Cleaning Program program was initiated in 2009 with one of the aims to create a complete database of asbestos contamination by 2012. In this blog post I’m hoping to shed some light on the progress of this ambitious plan.
I will be using data downloaded from Polish Public Data for this post. I also have done a bit of data analysis and manipulation on this that you will need to do if you want to produce the same plots. I’m not going to go into what I did here as it doesn’t fit the scope of this post, but the notebook that I did this all in can be found here.
Let us talk a bit about the data itself. The database is run by the Ministry of Development and should be updated yearly. It was originally uploaded on March 21st 2016 and then updated 8 months later. As far as I can see they don’t keep older versions. The spreadsheet contains columns with the total number of asbestos in the given location (in kilograms), how much of that has been utilised (also in kilograms) and how much still needs to be utilised (not kidding). There is also name of the place and its code TERYT. TERYT translates as the National Official Register of the Territorial Division of the Country. More info can be found here. It is a very useful thing in identifying cities and regions, especially for languages that include certain letters with diacritics, the overdot, the tail and the stroke. As a side note, TERYT code for asbestos dataset was incomplete i.e. missing the last digit (!). In addition, there was no metadata that describes the data collection process or time when it was taken. Thus, there is quite a lot of speculation ahead…
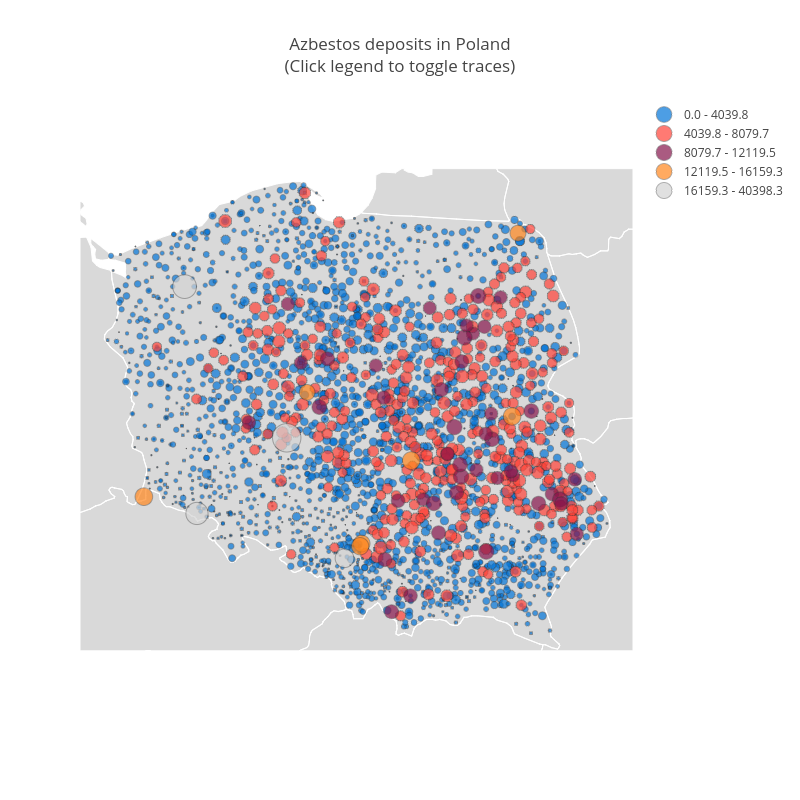
After weeks of trying to connect TERYT with geographical coordinates (check the notebook), I present to you the bubble plot by Plot.ly! Quite proud of it… If you hoover your mouse over the plot you will see more information about each location. Try it! Straight away what we see is that the majority of Polish cities and villages is contaminated with less than 4000 tons of asbestos (blue bubbles). I’m not sure if this is something that should be celebrated? For example, the small village that I grew up in, has 430 tons of asbestos–containing products hidden somewhere. This is a small village, approx 3000 inhabitants, and all its income comes from tourism. There is no other industry. Hence all this asbestos must be in peoples homes.
There are some outliers, like Drawsko Pomorskie (grey bubble in the north west), with more than 28 000 tons of asbestos! Now, is this because there is an utilisation plant there or the officials were extra diligent in that town and recorded all asbestos there was? Hard to say without metadata.
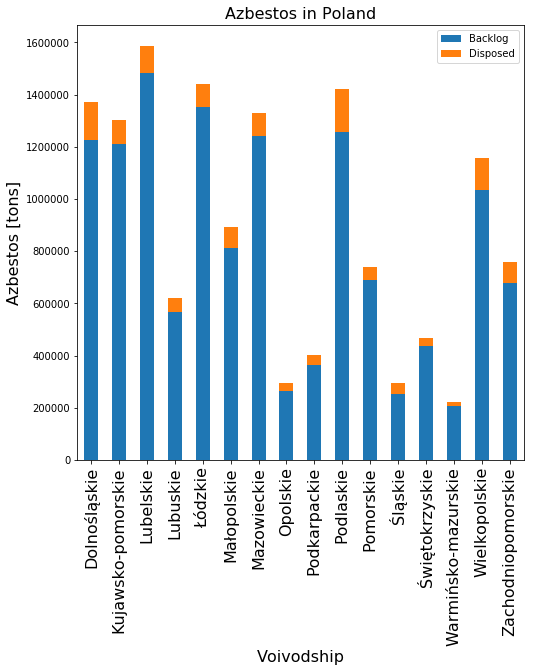
Can the data tell us something about the speed of the clean-up operation? Yes and no, again that metadata. Below I included a bar chart that contrasts the backlog against the utilised asbestos per voivodship (16 in total). If this information is accurate (as of end of 2016), then over 4 year period since 2012 each voivodship cleared less than 10% of asbestos.
This has big consequences for the public health as the erosion of the already installed, improperly taken down or stored asbestos contaminates air with airborne particles. Excessive exposure may lead to all sorts of serious health problems, like cancer. There are two types of cancer caused by the exposure to asbestos:
- cancer of the lung tissue and
- cancer of the membrane that surrounds the lung.
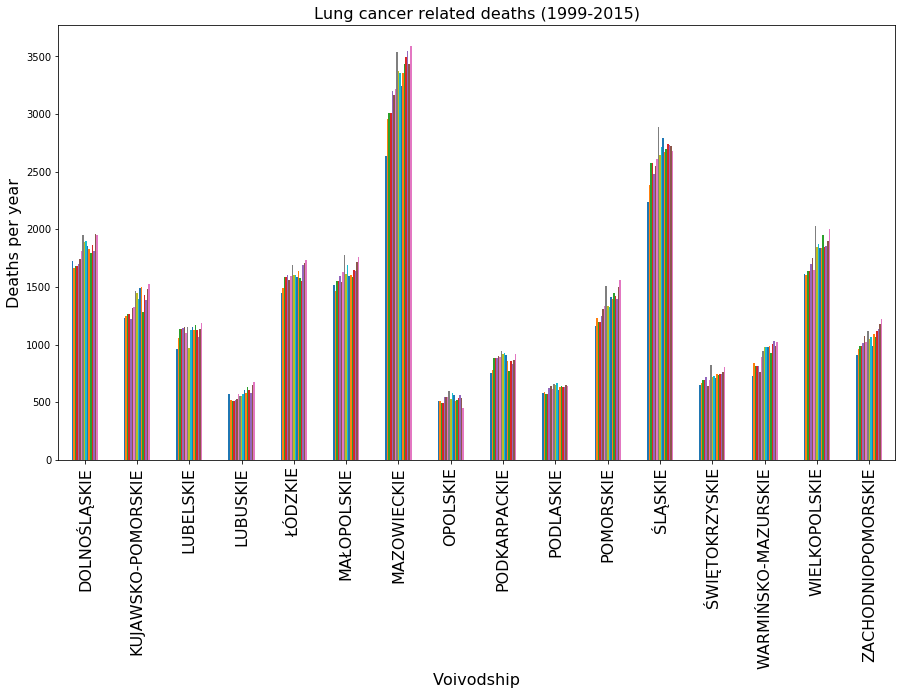
Since medical data is difficult to get, and for good reasons, the only statistics on the lung cancer related deaths I found cover the years from 1999 to 2015 for each voivodship in Poland. I downloaded it from the Local Data Bank. This data combines all deaths related to cancer of the respiratory system. The lung cancer doesn’t develop straight away after the initial exposure. It takes years or decades for the symptoms to appear.
From the stacked bar chart of the deaths per year per voivodship, you could see an upward going trend. Still, this is a very small sample to talk about any long term trends. If we had data that goes back few decades together with the number of tons of asbestos being imported and installed around Poland, we could be a bit more confident in our speculations.
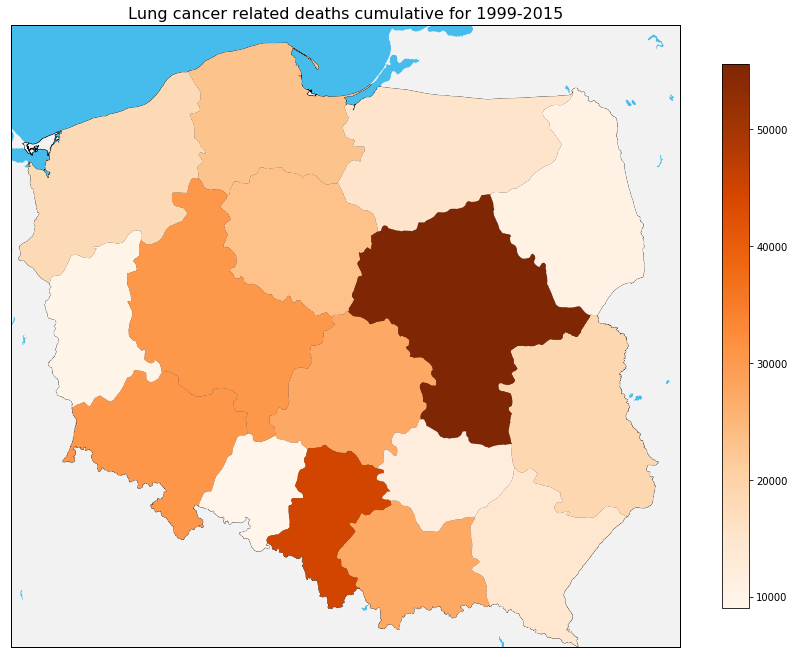
For someone that doesn’t know Poland’s geography, I also included a map of Poland with voivodships clearly outlined. I summed the deaths for all years per voivodship for an easy viewing. If we compare the two maps in this post, namely the asbestos–containing products per city and the cumulative death per voivodship, we can see some correlation between the density of asbestos and the number of deaths. Again, there is a lot of speculation because the granularity of both datasets is not comparable. Moreover, the air pollution in Poland is above the public safety limits and more cross analysis with air pollution data would be needed.
This analysis is in no way exhaustive or 100% accurate. I would love to hear your thoughts on how to improve this analysis. I’m planning to write more posts that explore datasets from Polish government sites so please help out!